I think this chart gives the feeling of plateau, because it’s showing the projected rates of growth at different times, but the move the baseline up to the actual production level at the time it was projected.
So actually each new estimate is for a higher rate of growth overall, but all have still fallen short of reality. Possibly because non of them had “idiot invades country unprovoked and disrupts worldwide oil supply” in the estimate.


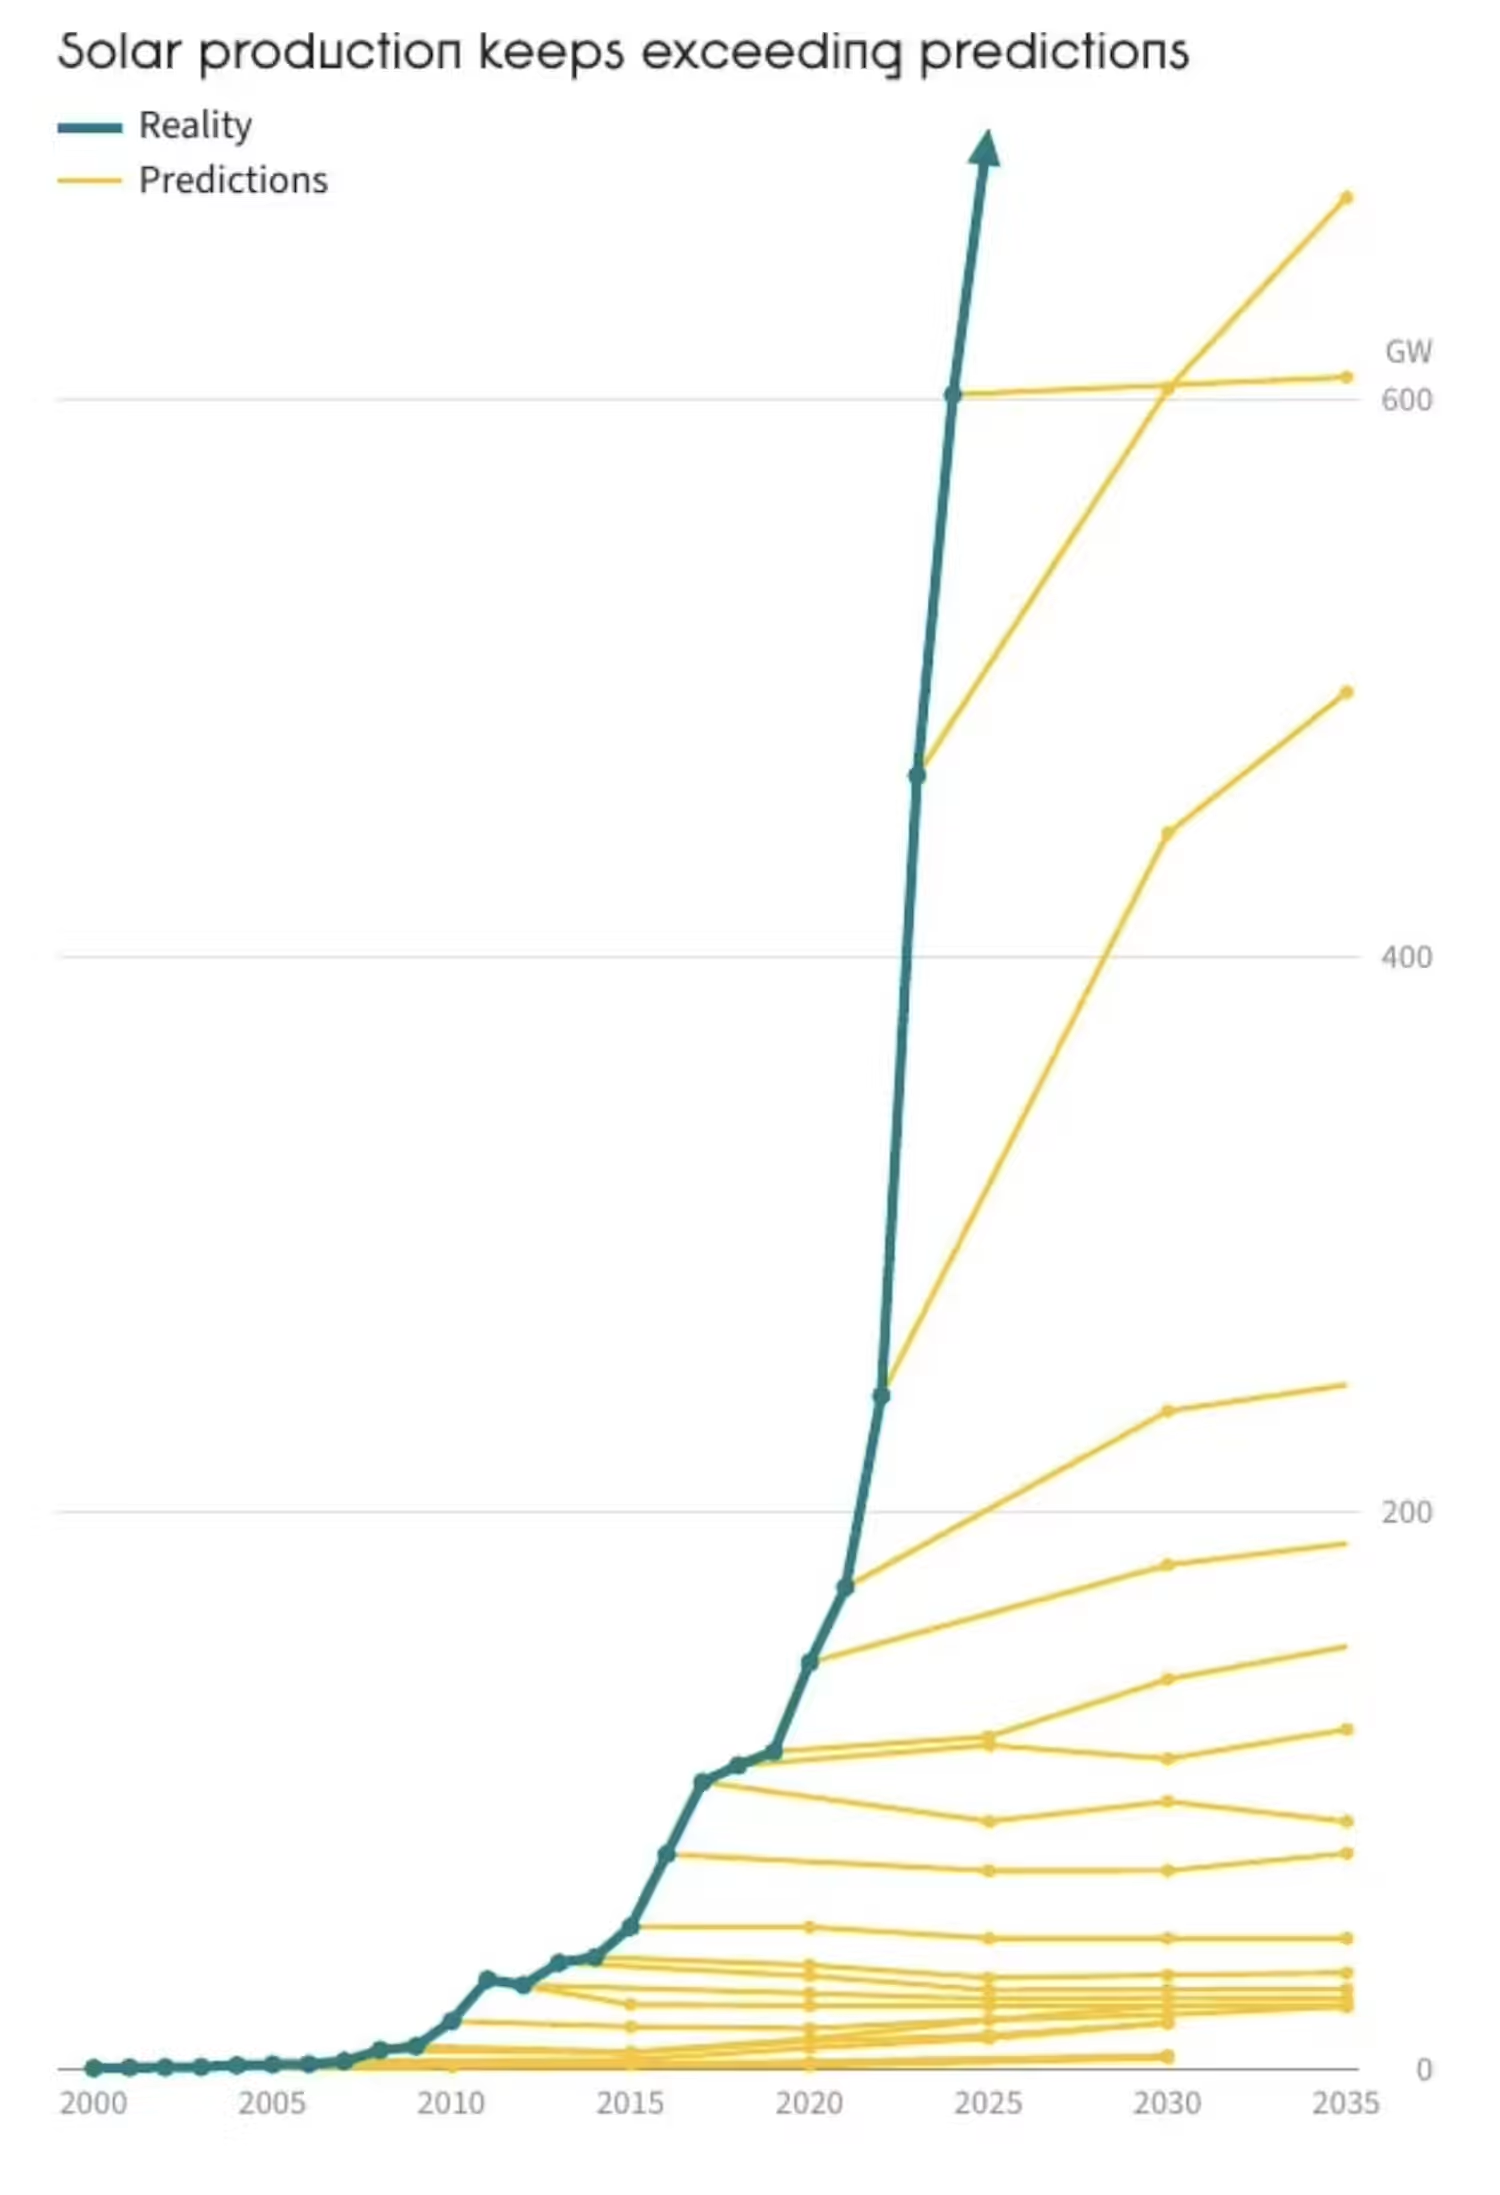
I think this chart gives the feeling of plateau, because it’s showing the projected rates of growth at different times, but the move the baseline up to the actual production level at the time it was projected.
So actually each new estimate is for a higher rate of growth overall, but all have still fallen short of reality. Possibly because non of them had “idiot invades country unprovoked and disrupts worldwide oil supply” in the estimate.