
Have been working on my Grafana dashboard recently and am thinking about what else I could add. So far, I have:
- CPU usage and temperature
- Memory usage
- Network usage
- Backrest daily backup status
- SMART status of drives
- CPU and memory usage of containers
Anything else that you find useful? I have a few other ideas, but am curious what others have up. Is everything on one scrollable dashboard, or do you have it organized across multiple?
usually add a bunch of random stuff, then forget it exists, only to check it half a year later and discover that 75% of prometheus exporters died for some reason
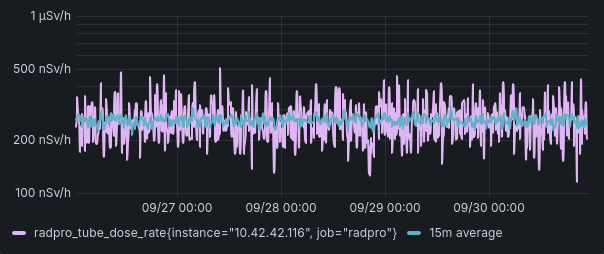
Haha, that’s probably what’ll happen to me eventually. I’ve already noticed a couple data sources missing that I’ve had to fix. Are you monitoring home radiation?
Prometheus and Grafana on the other hand - rock solid.
Yeah, since I’m collecting useless numbers I figured I should go all out.
I’d add backup age and size, not just status, like alert if the newest dump is older than ~26h or smaller than 1MB, a job can say success and still leave you a useless file. and disk fill with a threshold, not only the graph. learned that one the hard way, a table on my vps was getting a row every minute with no cleanup and one day the disk hit 100% and postgres just died for like 40 min, obviously nobody was looking at the dashboard right then lol. now 80% warns and 90% sends me an email, and uptime kuma checks the cert expiry from outside. I guess the dashboard is nice to look at but the stuff that matters should ping you
Size is a great idea, thanks. The problem with backup age is that Backrest doesn’t expose a metric for when the backup was attempted, so right now it’s just checking for failure status daily. That, of course, fails if backrest doesn’t attempt a backup for whatever reason. Chances of that happening, I don’t know, but I’ll have to look into implementing the metric (or label, I suppose) myself.
What I do for that is turn it around, instead of checking for a failure I alert on the absence of a success. backrest has hooks, so on snapshot success it pings a push monitor in uptime kuma (healthchecks.io works the same), and if no ping arrives in ~26h it alerts. That way it catches the backup that never ran, which is the one that scares me the most I guess
Oh, that’s really interesting! I couldn’t find a way to find absence of success given Backrest’s metrics alone, but using hooks for that seems to solve that problem well. Thanks!
- grafana dashboards https://github.com/nodiscc/xsrv/tree/master/roles/monitoring/grafana/files
- victoriametrics alerting rules https://github.com/nodiscc/xsrv/tree/master/roles/monitoring/victoriametrics/files
Other than the items you mentioned I have dashboards for:
- SSH/SMTP honeypot
- Jellyfin
- Pihole
- Torrents
- Tasmota (smart plugs)
What kind of things do you monitor with the Jellyfin dashboard? Would definitely be cool to put up monitoring for Transmission. I was thinking about putting up an Adguard instance to monitor it lol
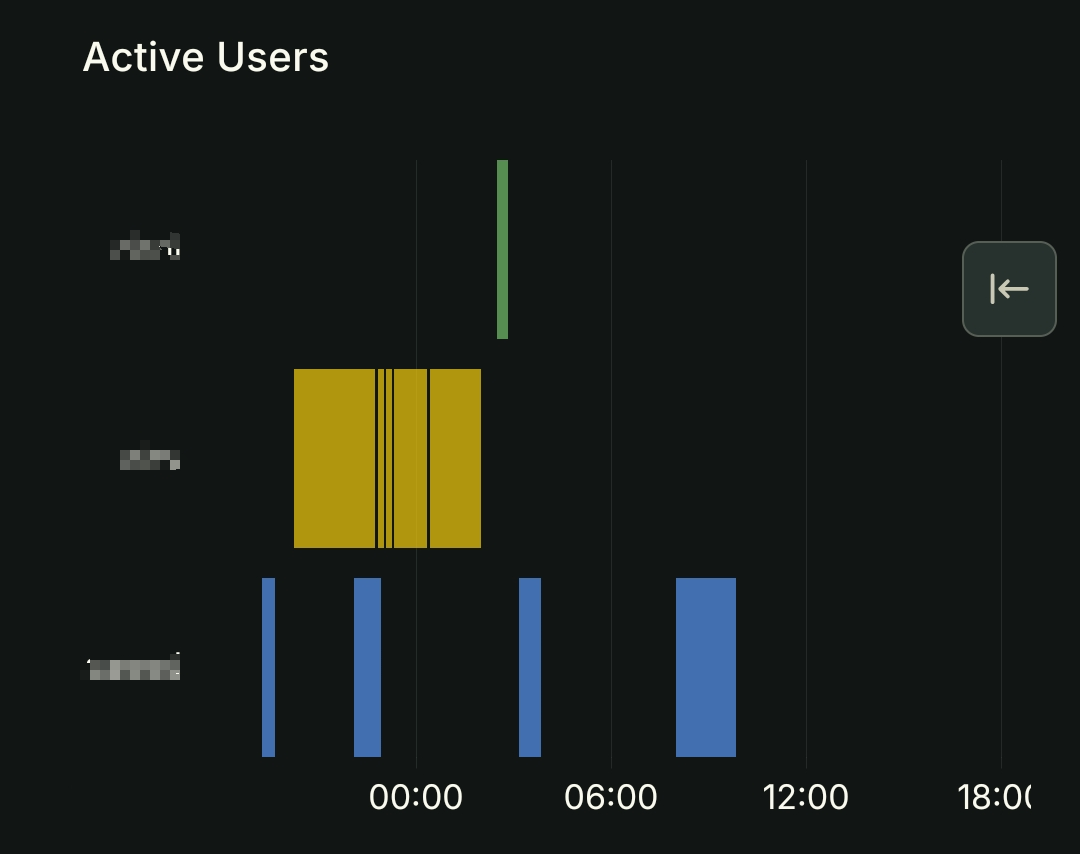
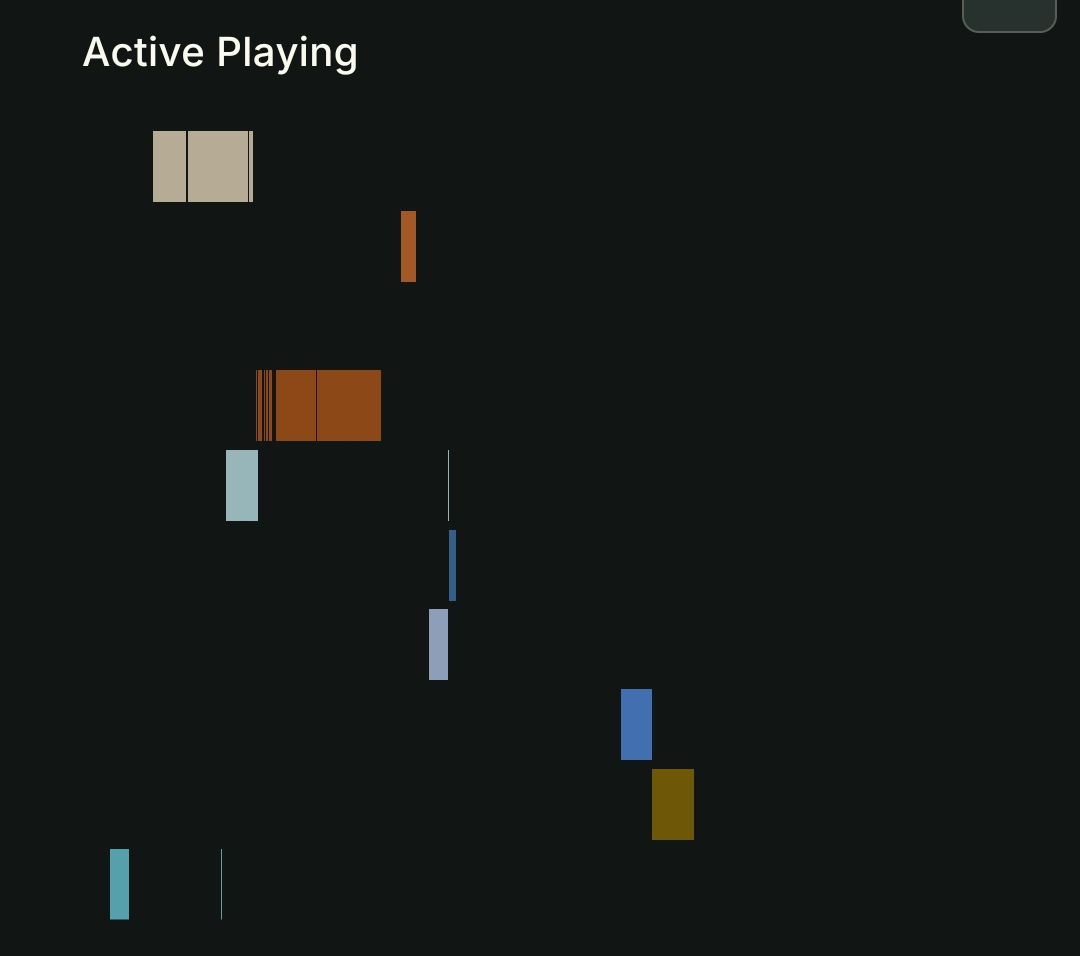
Jellyfin exporter has all kind of metrics but the ones that interest me most are active users and media played. I have a nice panel that shows who played what, when and for how long. Would also highly recommend monitoring your torrent server, that has produced all kinds of useful and interesting (to me!) metrics.
What kind of visualization is the Jellyfin panel? I’m curious how that data is organized. Torrent monitoring is definitely at the top of the list for Grafana priorities, would be super useful for me
These two are my favourite, first shows active user timeline and second shows active playing timeline (names cut off on mobile). Ideally I would combine them together but have not found a way to do so yet, probably skills issue
I have a series of Tasmota esp32’s with Temp/Humidity/Barometric Pressure sensors around the house, attic, garage and outside. I scrape it into influxdb and have a Grafana dashboard setup.
How much does each sensor wind up costing, esp32 and all? That sounds really interesting. I think I have an esp32 laying around that I haven’t gotten to playing with yet.
I found a pack of 5 on Amazon for $20, for each of the sensors and the esp32’s… so $40 for 5. Probably cheaper in Ali or similar. The only negative is they need some calibration. The ones from Adafruit are better quality and already calibrated, but much more expensive.