

2·
6 days agoThese two are my favourite, first shows active user timeline and second shows active playing timeline (names cut off on mobile). Ideally I would combine them together but have not found a way to do so yet, probably skills issue
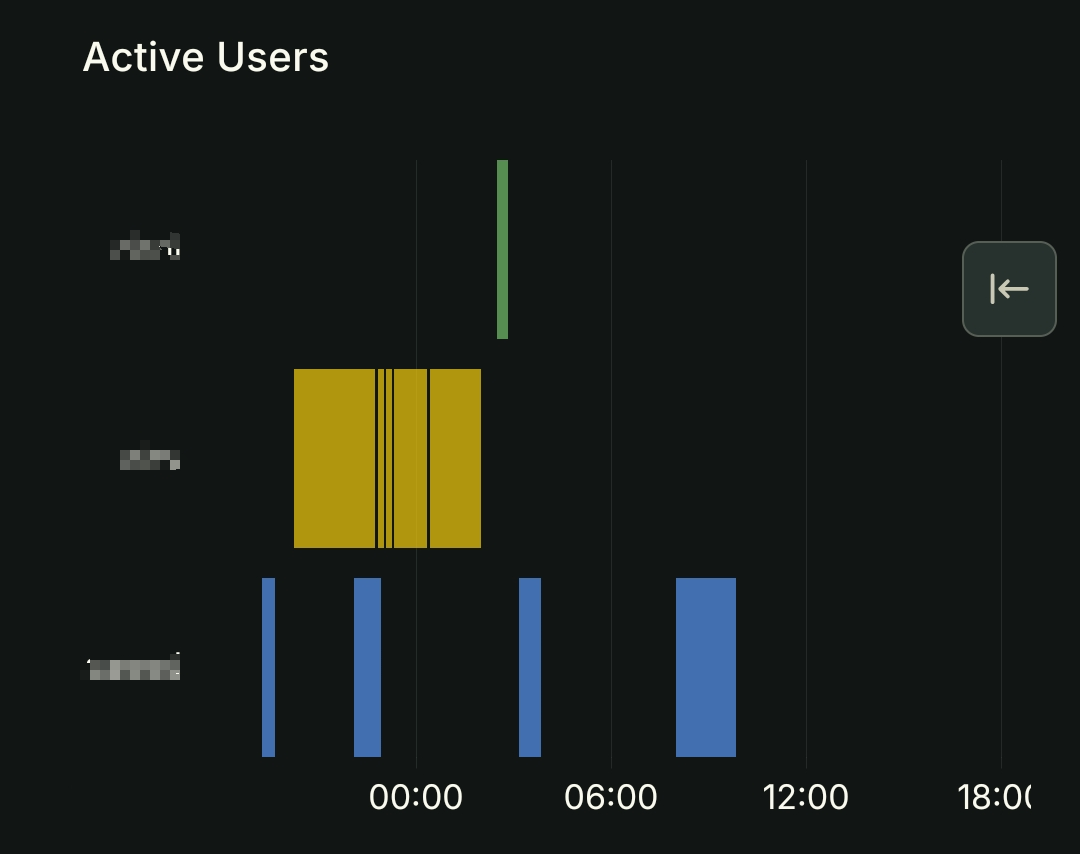
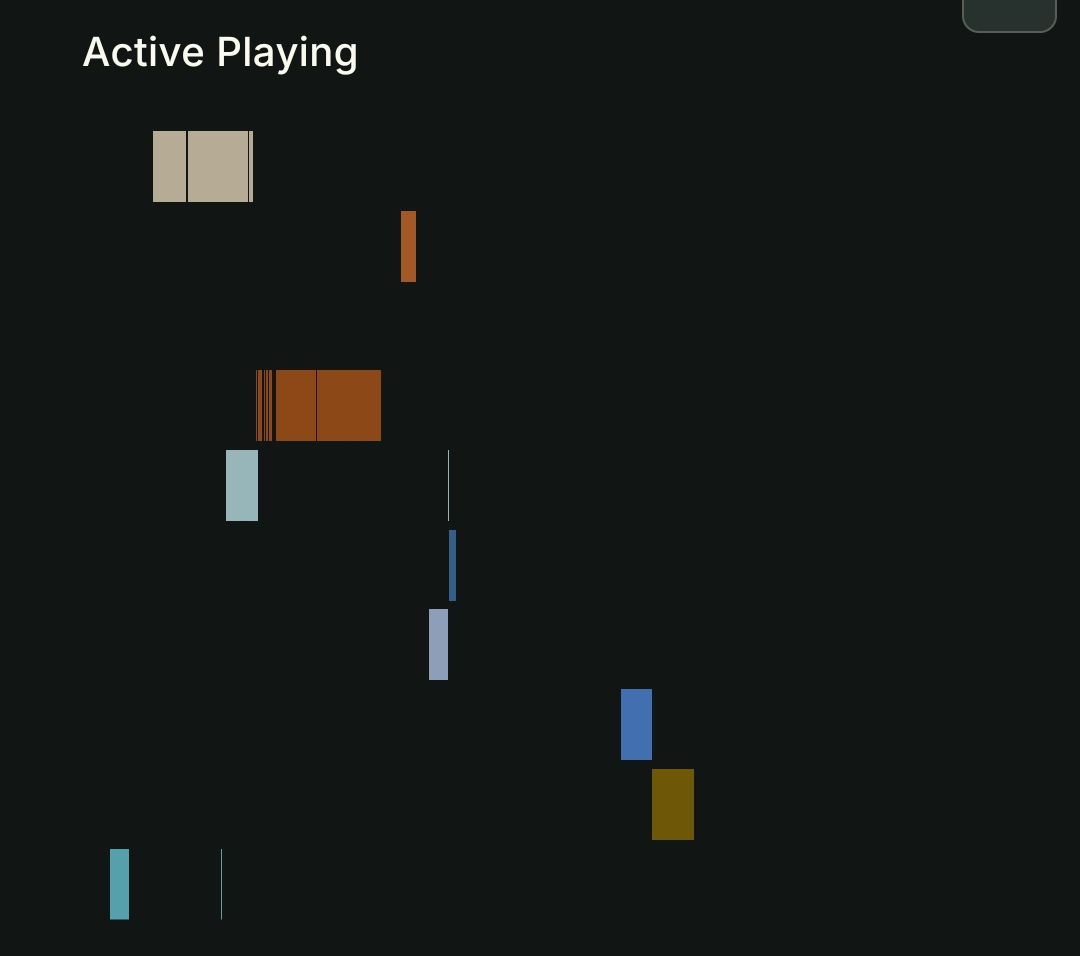
These two are my favourite, first shows active user timeline and second shows active playing timeline (names cut off on mobile). Ideally I would combine them together but have not found a way to do so yet, probably skills issue

DevOps engineer for a SaaS company.
There are far more non-nerds in comments than I would have expected.
Jellyfin exporter has all kind of metrics but the ones that interest me most are active users and media played. I have a nice panel that shows who played what, when and for how long. Would also highly recommend monitoring your torrent server, that has produced all kinds of useful and interesting (to me!) metrics.
Other than the items you mentioned I have dashboards for:
Sorry for the spam but I in fact managed to join the two panels together. y-axis is users and x-axis is timeline of what they watched. Grafana unfortunately does not natively support different colour for each series block.